With a little help from my friends – the Fab Four of hotel distribution
By cameron in Uncategorized
Sponsored by RateGain.
The reason why The Beatles are so popular could be down to the fact that they practiced a lot. That doesn’t sound very “rock’n’roll” but it was a great factor in their success.
The 10,000 hour rule
When the Fab Four landed in the US in 1964, “they had performed live an estimated 12,000 times”, according to author Malcolm Gladwell. In his book, Outliers, Gladwell popularized what became known as the 10,000-hour rule, by documenting the lives of successful people such as Bill Gates, Mozart and – of course- the Beatles.
“Ten thousand hours is the magic number of greatness”, he wrote. Gladwell was inspired by the work of Daniel Levitin, the neurologist who scientifically proved that “10,000 hours of practice are required to achieve the level of mastery associated with being a world-class expert in anything”.
The theory is fascinating, though, not always reliable, especially in our industry.
HRS, for example, with almost half a century (or 400,000 hours) of great experience under its belt, today has a different market share than it used to have. Some but not all companies born 20 years later have outgrown it.
The 10,000-hour rule doesn’t equate mastery with market share and other criteria apply.
A defining factor here is the ability to adapt and evolve. Music, not unlike business, is – in fact – Darwinian. That’s why fathers and mothers may prefer the cheesiness of “Please, Please Me”, while sons and daughters opt for pick the psychedelia of Sgt. Pepper’s Lonely Hearts Club Band.
As Marty McFly once wisely said, “I guess you guys aren’t ready for that yet. But your kids are gonna love it”.
Don’t stop clicking around
So, what exactly are our kids going to “love” when it comes to hotel distribution? Even though it seems like distribution is ever-moving, there are clear patterns and trends. According to Phocuswright, for example, 2016 was “the first year when OTA lodging bookings in the U.S. exceeded total hotel website gross bookings”. On top of that, forecasts expect OTAs to reach over 40% market share by 2020.
This means that despite above-the-line marketing, targeted discounts and revamped loyalty programmes, consumers are not shifting to direct as their primary booking option as intensely as the big chains wanted.
With this in mind, perhaps hotels should start reconsidering their relationships with online travel agencies and focus on the channels bringing the highest profit and volume.
Embracing OTAs does not mean dropping all direct booking strategies. Hotels need to understand the intrinsic characteristics of each distributor. In an age where OTAs and wholesalers flex their rates across metasearch engines or marketplaces it is very unlikely that users will just “stop clicking around”.
For the writing of this study, RateGain provided with distribution data from over 3,000 properties all over the world, in order to identify patterns and anticipate possible trends. The article you are reading is the result of this analysis.
Methodology
Nearly 3000 properties – 2,893 to be exact! – were analyzed over two key markets: Asia/Middle East (60% of the total data set) and Europe (26%). The balance were located across the Americas and Africa, Oceania and the Caribbean in roughly equal measure.
All data come from RateGain’s two-way-integrated channel manager so the human error involved is virtually zero.
The period taken into consideration is Q1 and Q2 of 2018, compared to the same period from the previous year. In order to understand where the market is going, rather than where it is, all reservation data have been extrapolated on booking date, not stayed date, and cancellations were deducted from the final data.
The only unorthodox method used was the Beatles metaphor, so Booking.com is our Paul, Expedia our John (even though there has been an internal diatribe about which one was the better songwriter… Well, I won), Agoda is George and HRS… Well, someone must be Ringo, after all!
The Fab Four: booking.com, Expedia, Agoda and HRS
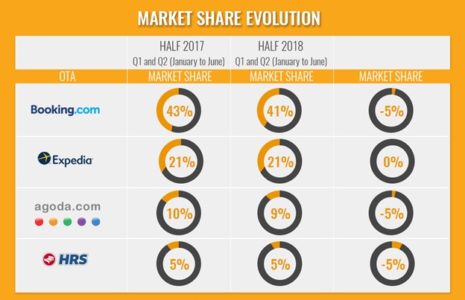
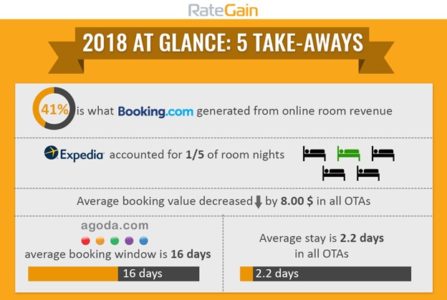
While working on this piece, one immediate data point that leapt out was that these four OTAs alone accounted for more than two-thirds of the whole online room revenue, with booking.com on the podium (43% in 2017 and 41% in 2018), followed by Expedia (stable at 21%), Agoda (10% and 9%) and HRS (5% and 4%). Only 22%-25% of revenue was generated by all the other distributors combined.
Moreover, the only distributor with a market share of more than 3% in both periods was Traveloka (4% and 7%). The name may not ring a bell for European and American readers, but 26% of the hotels analyzed in this study are located in Traveloka’s home market of Indonesia. The market share dominance of the Fab Four is likely to be even higher in non-Asian markets.
Room revenue – no alarms and no surprises
When looking at OTAs’ market share evolution, of note is a slight decrease (5%) in both Booking.com and Agoda. As I’ve already mentioned in the methodology section, almost 2/3 of the properties analyzed are located in Asia and Middle East, and this may explain this negative trend.
In the first half of 2018, in fact, Traveloka increased its generated revenue by over 200%, while all the other minor players remained stable, decreased or even disappeared completely, so when you look at that 4% market share that the Fab Four lost in 2018, remember that it went almost entirely to the above-mentioned Indonesian distributor.
In terms of revenue generated, in fact, the only other players worth mentioning were GTA (4%), HotelBeds (3%) and Tourico (1%). All the others combined accounted for only 10% of all revenue.
The 11 % drop for HRS can look catastrophic at first, but the German OTA started at a considerably lower market share position (5%) last year, even though it’s an indicator of the state of health of the company.
Expedia remains stable with 21% of market share, possibly because of its more aggressive strategy in Europe. The group, in fact, has been pretty open to review the contract terms with its European hotels over the past year, and this (together with a highly performing Travel Ads system) spurred European hoteliers to increase their inventories on Expedia.
TIP: Work closely with your Expedia market manager who can help strategize about which technology tool on PartnerCentral will work best for your property.
Room nights: same old, same old
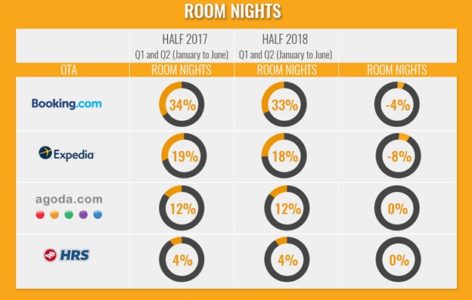
The room nights trend, not surprisingly, almost perfectly match the generated revenue’s one. Both Booking.com and Expedia, in fact, lose a point. Agoda remains stable.
TIP: Even though there’s still (a little) space for local OTAS, Booking.com and Expedia remain the most solid and reliable distribution channels for your hotel. Do not consider them as enemies, but as allies.
Rates are dropping everywhere, but they are doing it faster somewhere else
Things get more interesting when breaking down the booking value.
We hear hoteliers complaining about rates going down on a daily basis, to the point that it became an industry cliché.
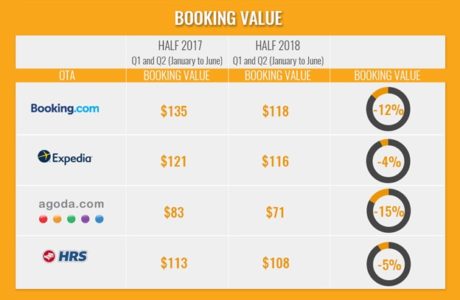
Turns out, anyway, that they’re right. Overall, the booking value decreased by $8.00 in 2018 to $102.00. The data is particularly acute on Booking.com (a $27.00 drop) and Agoda ($12.00). With “only” $5.00 of rate difference, Expedia and HRS seem to hold on.
What could be the causes? Booking.com’s Genius program very likely played a big role here (interestingly, if you take 10% of 2017 Booking.com’s average booking value out, you almost get to its 2018’ average booking volume) together with Agoda’s super discounted coupons.
TIP: Average booking value is dropping, but some OTAs are holding up. Give them more inventory in order to increase profit.
Stays get a little shorter
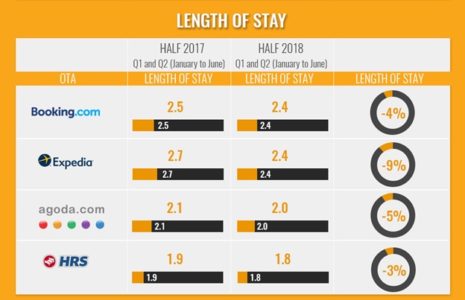
Negative, yet less dramatic, is a drop in the average length of stay – 2.3 nights in 2017 versus 2.2 in 2018. Expedia lost its slight advantage in terms of length of stay. HRS length of stay is the shortest.
Book early and save? Not really…
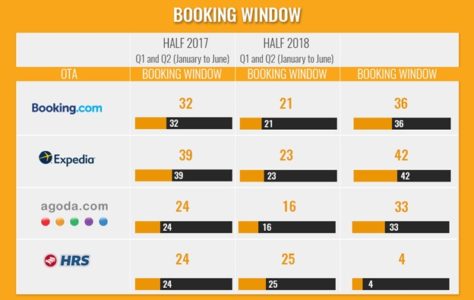
When things start to get alarming, though, is when you look at the booking window evolution: on average, in 2018 guests booked 8 days later than they did last year, with a booking window of just three weeks.
An increase in last-minute reservations is not good news for hoteliers: it’s harder to forecast and revenue managers tend to get nervous when the pickup pace is slow, so they start publishing anxiety-driven rates, resulting in lower booking value (as previously shown). Germans have a reputation for being organised in terms of their holidays, and the data confirms it – a 25-day-booking window for HRS compared with 16 days for the Asian travelers of Agoda.
TIP: Booking window is dropping year after year. Make sure to have a solid rate strategy in place and avoid last-minute-panic-prices.
One in five reservations will be cancelled
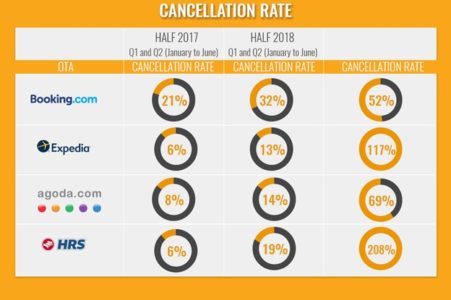
I would have loved to close this study with some more positive data, but that is not the case. As well as booking value dropping and the booking window shortening, the cancellation rate doubled in just one year.
During the first six months of 2017, in fact, the average cancellation rate was 10%. In 2018, this number spiked to 20%.
As always, anyway, each OTA is different. Booking.com’s guests seem to be compulsive shoppers with a lot of regrets, as only two out of three actually show up at the hotel. It outperforms its competitors by far on several positive aspects but, when it comes to cancellation rate, it brings the big guns on the table.
HRS also recorded a big hike in its cancellation rate.
TIP: Just as with booking window, high cancellation rates mean worst forecasting and, ultimately, less profit. Create more rigid policies for high-cancellation-rate OTAs or prefer Not Refundable Rates over BARs.
Conclusion: The Breakfast Club
When you started reading this article you’d probably have your own opinion on who were the Pauls and Ringos of online hotel distribution. And so did I.
But the reality of things is almost never so simple and linear. It transpired that each OTA has its own distinctive strengths and weaknesses. Sure, Booking.com accounts for over 40% of your revenue, but 1 out of 3 guests will cancel, HRS brings less revenue, but it has the longest booking window.
So, the reality is that, to paraphrase John Hughes’ classic 80’s movie, “each one of them is a Paul, a John, a George and a Ringo.
Does that answer your question?”
Sponsored by RateGain.
- Do you want to know how to optimize your revenue management get tips on price, inventory management and distribution? Make sure to sign up for the next RateGain webinar, “The Last Available Room”, talking place on September 20th, 3:30 PM – 4:30 PM CEST.Join Gaurav Singh (Product VP @ RateGain), Morten Skriver Larsen (Head Of Product Marketing , Booking.com) and Fiona Gillen (VP Marketing, thehotelsnetwork) in a one-hour free event moderated by Enzo Aita, global head of marketing hospitality, RateGain) and Simone Puorto (travel tech journalist & founder, @ Simone Puorto Consulting).The webinar will be conducted directly from Booking.com headquarter in Amsterdam as a very exclusive live session.
![]()


