Not what you’d expect: This type of image holds the most power of persuasion for travelers
By cameron in Uncategorized
This is a viewpoint from Peter Cassidy, Co-founder and CMO at Stackla.
They say a picture is worth a thousand words, but some pictures tell a better, more authentic story than others.
When you’re looking to plan your next vacation, what type of images do you trust more: the professional photos posted by the destination or hotel or the photos posted by other travelers who’ve already been there?
While polished professional photos are nice to reference, most people inherently trust pictures posted by real people more than any other form of advertising.
According to Google, 83 percent of travelers use social networking, video and photo sites as online sources of travel inspiration, and BLITZ revealed that 84 percent of Millennials are likely to plan trips based on someone else’s vacation photos on social media.
This user-generated content (UGC) has become an invaluable tool in the visually immersive world of travel, where people now regularly seek inspiration and validation from the content other travelers post online every day.
How over 489,000 pieces of user-generated content performed
At Stackla, we work with over a hundred travel brands around the world, helping them discover, curate and showcase this compelling traveler content across their owned and paid marketing channels. This got us thinking about three key questions:
- Exactly what types of content are travel brands leveraging from social networks?
- Which (and how many) of those pieces of content are they choosing to publish across their marketing channels?
- What visual content performs best with travel audiences?
To answer these questions, we looked at over 489,000 pieces of UGC aggregated by six different brands across the travel industry during July and August of this year.
By analyzing not only the content they aggregated and published but also the best performing UGC by impressions, clicks, and interactions, we identified some key trends and takeaways all travel brands should take note of.
The most sourced and published travel UGC
Of the 489,000+ pieces of UGC aggregated by our sample of travel brands, 91 percent were images, over 7 percent were videos and less than 1 percent were text-only posts.
Since images reigned supreme, it’s no surprise that the predominant source for great travel UGC was Instagram, with 98 percent of UGC aggregated from the leading image-based platform.
While these travel brands had access to thousands of pieces of authentic content, they were selective with the UGC they decided to showcase. Only 9 percent of the 489,000+ pieces of aggregated content were published across theirowned channels. On average, 89 percent of the published UGC were images, more than 6 percent were text posts and nearly 5 percent videos.
They also relied more on location than hashtags when sourcing UGC to publish on their sites, with 74 percent of the published content having been aggregated by location data as opposed to a specific hashtag, which made up only 26 percent of the UGC published.
So what did these 40,000+ published traveler photos and videos consist of?
On average, 39 percent were of landscapes and 35 percent contained people, while over 9 percent showed wildlife and 4 percent featured food.

Data from Stackla
The content that performs best for travel brands
When it comes to the images potential travelers respond to most on travel sites, our analysis showed that scenic images trump selfies.
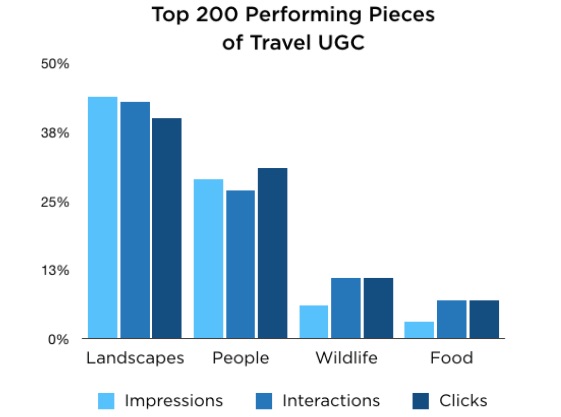
We examined the top 200 pieces of travel UGC by impressions, clicks, and interactions across all six travel brands based upon data from January – August 2017. Of the top 200 pieces of content by user impressions, on average 44 percent were landscape images and 29 percent featured images of people, while only 6 percent included food and 3 percent featured animals.
When we looked at the top 200 published UGC by interactions (clicks, shares, likes, votes), it told a similar story.
Forty three percent were landscape images and 27 percent were of people, while wildlife images represented a greater portion at 11 percent and photos featuring food made up 7 percent.
Landscapes continued to lead the way when we looked at the top 200 pieces of content by just clicks, with an average of 40 percent featuring landscapes, 31 percent including people, 11 percent containing wildlife and 7 percent featuring food.
Tips and takeaways for travel marketers
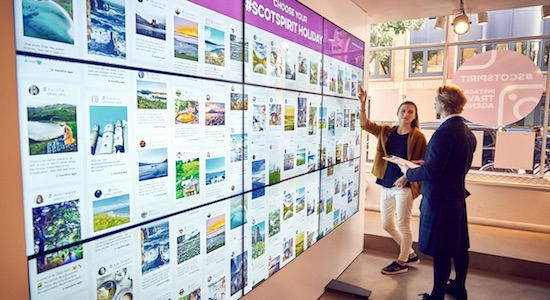
Instagram has become the go-to place for travel brands to source authentic, engaging content to fuel their marketing channels. In fact, VisitScotland (a Stackla customer) just opened the world’s first Instagram Travel Agency in London, featuring interactive UGC walls to help people discover all Scotland has to offer.

The VisitScotland Instagram wall
Tip: If your brand isn’t leveraging the high-quality visual content Instagram users are creating every day, you’re missing out on a goldmine of free, authentic and impactful content. Start incorporating real guest and visitor Instagram images throughout your webpages, ads, live screens and even emails to attract, engage and sell to potential travelers.
Travel brands are experimenting with UGC videos
While UGC images are the main point of focus for many brands, marketers are experimenting with UGC videos. All six brands we examined, in varying degree, sourced and published traveler-created videos for their marketing campaigns.
Tip: Videos can provide more immersive experiences for prospective travelers than any site or brochure deliver – particularly GoPro footage and 360 videos. Since only about 5 percent of the UGC published by our selected mix of travel brands were videos, there’s an opportunity for other brands to begin aggressively testing the efficacy of consumer-created videos across their websites and social campaigns.
Consumers respond to genuine content that reflects the experience
Travel brands are seeing the most success when displaying user-generated images of landscapes, like beaches, seas, mountains, cities, skyscrapers, etc. However, consumers have also been proven to engage with UGC that shows travelers actually living those experiences in pictures.
Tip: Whether a beautifully scenic panorama or a portrait of people in paradise, content created by real travelers resonates with consumers. Yet, while the trends we’ve identified here can help guide your visual marketing strategy, every brand is unique. To truly know if these trends hold true for your business and audience, you must constantly test and optimize your content. Luckily, marketer’s today have many tools at their disposal to help perform and manage this type of ongoing analysis.
Do you know that content resonates best with your audience?
This is a viewpoint by Peter Cassidy, co-founder and CMO at Stackla. The views expressed are the views and opinions of the author and do not reflect or represent the views of his employer, tnooz, its writers or partners.
Photo by Patrick Tomasso on Unsplash.
![]()

