Facebook Reactions – a year of wow and haha for travel and tourism?
By cameron in Uncategorized
Facebook Reactions has just celebrated its first birthday – a reason if any to share a love heart-style – or angry – emoji.
But, seriously, while not everyone greeted Reactions with excitement, the milestone means that there’s data around its popularity with consumers.
The social media marketers at Spredfast crunched the numbers, analyzing 67,000 Facebook posts from 100 brands, and compiled into its latest Smart Social Report.
Among travel brands, the team considered Hilton, British Airways, Marriott, Southwest, Airbnb, American Airlines, Carnival, Emirates, Lufthansa, and the W. Here are the highlights.
Slow and steady wins the race?
It’s less of a sprint and more of a marathon in the race for Reactions. Initially, the feature was not that popular, despite plenty of global coverage.
The move away from just the one ‘Like’ button was a big departure for Facebook, so it’s sensible that users would be somewhat reluctant at first.
In the last month of analysis, the overall activity on Reactions reached nine percent of all interactions.
That’s a marked improvement over the first two months, which made up only one percent of user response. Each month, users are becoming more comfortable with reacting using the new emotions.
So even if your community hasn’t warmed to Reactions, that time seems to be coming soon.
Reactions are quite popular in travel and tourism
The question of industry benchmarks is always top-of-mind when it comes to any new feature on social media. How does my performance stack up against my competitors?
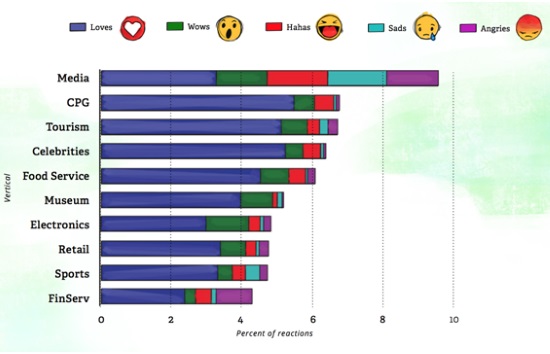
Now we know: tourism performs well with Reactions. Given the emotional and inspirational nature of travel content, it’s heartening to see this translated into a large percentage of Loves, Wows, and Hahas.
As with all surveyed sectors, Loves garnered the most clicks, with nearly five percent of responses in travel. Users were ‘wowed’ by content at just under one percent of the time.
Despite any ongoing mainstream narrative about frustrations with travel providers, the Angries make up a much smaller percentage of Reactions than in the other top performing verticals, Media and Consumer Goods.

Whether Reactions are a popularity contest — or a sign of a more engaged audience willing to respond with nuance to a brand’s content — one travel brand came out on top: Southwest.
The airline’s followers responded to its content with a non-like Reaction nearly ten percent of the time!
Winners and losers
Not all Reactions are created equal. Enthusiasm is winning the day on Facebook, with Loves taking the spot behind Likes as the most popular way to respond to a piece of content.
However, as Spredfast explains, there’s some competition in store for the dominance of the Love:
“We found that Loves were the most frequently used of all non-like reactions, but that the biggest gains came from the Haha reaction, with an 185% increase in usage in the last fourth quarter of the year.
“Users also become much more comfortable with the Angry reaction–increasing its adoption by 87%.”
Optimizing content for Reactions
What does this mean to travel marketers? Given the additional range of options, be sure to consider how users react with your content.
If your audience leans towards the Reactions, then start encouraging more of those sorts of interactions.
Each interaction means that Facebook sees your brand’s content as engaging — that means potential organic reach and more affordable pricing for any paid promotions on that content!
Polls can also be a handy way to entice users to react.
Rather than using the traditional poll format, ask for responses via Reactions. This gives you an idea of how engaged your audience is with both your own content, and the Reactions product in general.
Finally, if your content is garnering different Reactions than you expected — for example, a funny video that actually makes people angry — use this rich data to adjust your course.
This informal feedback system can dramatically increase the speed at which user feedback is incorporated into content strategy.
![]()

