Airbnb – never mind the volumes, look at the growth
By cameron in Uncategorized
Certify‘s findings for 2016, based on expense claims filed through its system, includes some proper statistics for Airbnb.
During the year just gone, Airbnb continued its run of doubling transaction volumes every year since 2014. No specific room night numbers are revealed, but Certify does specify that, out of all the hotel expense claims filed, Airbnb is now responsible for 0.27% of the total.
A market share of less than 1% is not as weak as it first appears. Certify points out that the most expensed hotel chain – Hampton Inn – accounts for 8.82% of the total. Residence Inn, which props up Certify’s top 15 expensed hotel chain league table, accounts for 1.18%.
Certify says:”Assuming a similar or slightly improved growth rate, Certify expects Airbnb could approach the top 15 most expensed hotels sometime late next year.”
Another stat around Airbnb in the 2016 report shows that the average stay is 4.51 nights, compared with traditional hotels where the average is 2.58 nights.
Robert Neveu, CEO of Certify, said:
“The growing preference for sharing economy services like Uber and, to a lesser degree, Airbnb really underscores the trend toward consumerization of traditional corporate travel.”
Uber was the most expensed brand across all categories in 2016, accounting for 6% of the total. Uber now accounts for more than half of all expense claims in the ground transportation category, although Lyft has grown more strongly over the year.
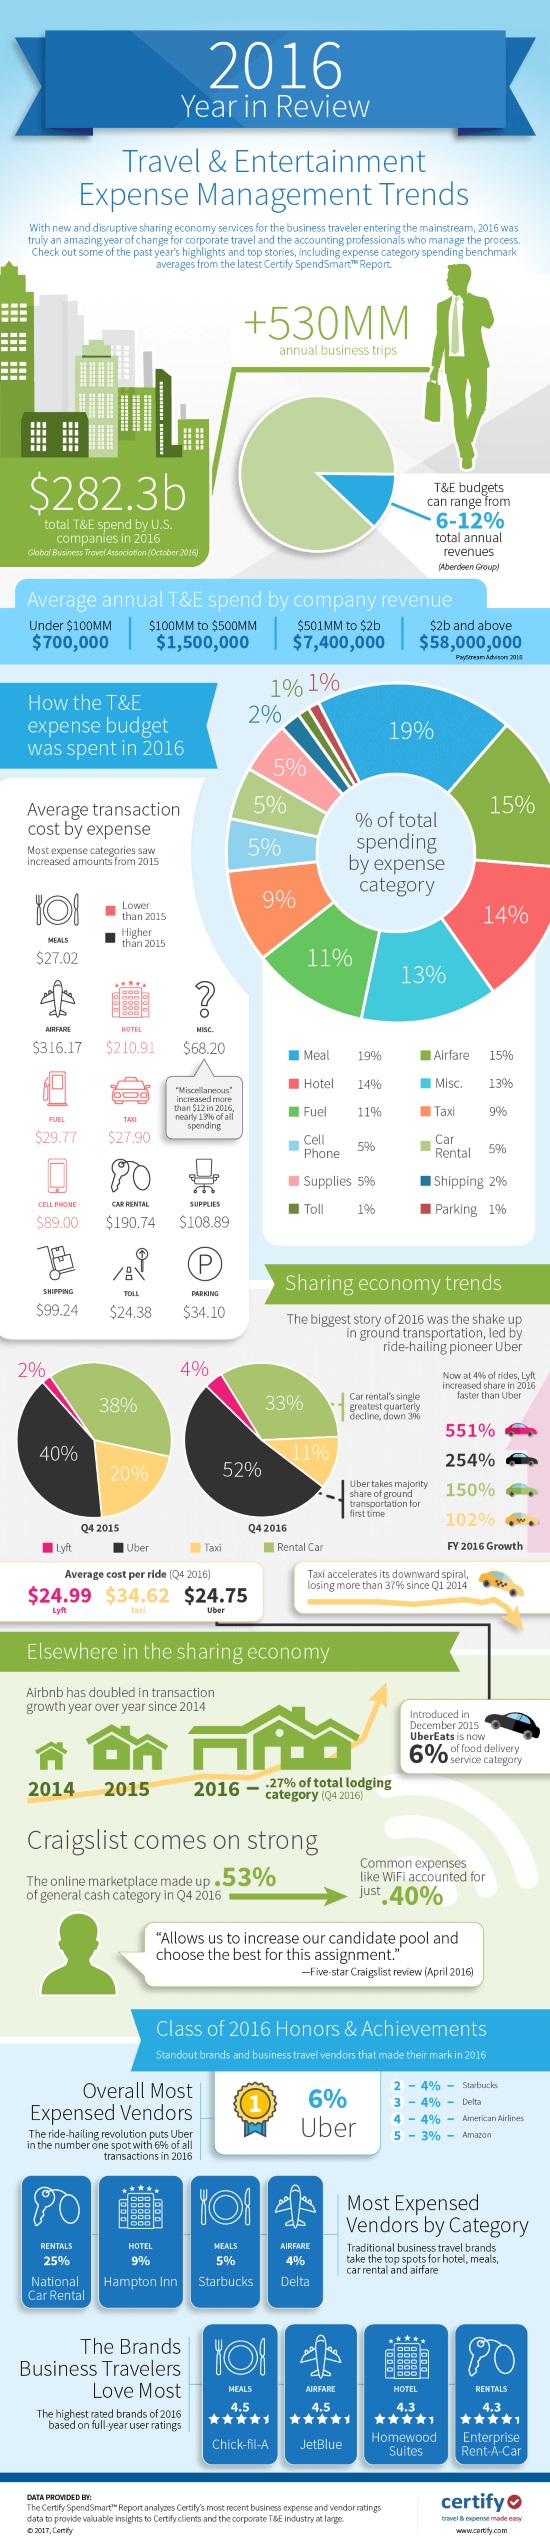
Certify has produced a detailed infographic which summarises its findings for 2016:
![]()